
Appearance
ARMS Overview
Understand what your AI agents are doing, measure their performance, and improve them in production.
The product sidebar is Home, Dashboards, Monitoring (Telemetry, Agents), Resources (Vault), Configuration (Evaluations, Manage Models, Pricing, Organisation), and Settings (User Profile, Api Keys). Prompt Hub, Contexts, Rule Engine, Openground, and Fleet Hub are not shipped. With ARMS teams can Trace LLM and agent calls, compare models, detect regressions, and optimize cost and performance using real production data.
Observe
LLM observability and AI agent observability for agents built with CrewAI, LangGraph, or any agent framework. ARMS brings OpenTelemetry-native instrumentation so you can analyze how your agents perform in production with full stack visibility:
- Tracing - Instrument once via OpenTelemetry-native SDKs for 90+ LLMs and agent frameworks to produce OpenTelemetry traces.
- Lowest level transparency - Exceptions Monitoring surfaces errors with full stack traces and span context so you know exactly where and why something failed. All telemetry is automatically redacted for sensitive data before it leaves your stack.
- Understand cost and latency - Track token consumption, spend per model, provider, and request. Monitor GPU utilization alongside LLM call latency in custom dashboards built on your raw telemetry.
Improve
LLM evaluation in production and development using the same evaluators. Close the loop between what you ship and what you measure:
- Online LLM evaluation - LLM-as-a-judge runs on live traces after you configure the Evaluation Engine (provider, model, and Vault key). Create custom evaluators with your own scoring criteria.
- Offline evaluation and CI/CD testing - Use the same evaluators via the programmatic evaluations API for regression testing in CI pipelines and local development. Catch quality regressions before they reach production.
- Traceability - Every evaluation score is linked back to the exact model and trace that produced it so you know what changed and why quality shifted.
Manage
Manage the agents, keys, and pricing behind your AI stack from one place:
- Track and manage agents - See every agent version running in production, monitor health, and manage deployments from the
/agentspage. - Vault - Centrally store and rotate LLM API keys that agents retrieve at runtime. No restarts, no code changes, no secrets in your codebase.
- AI cost tracking - Manage models and Auto Pricing under Configuration. ARMS ships with pricing for popular models and applies it across traces, dashboards, and cost reports.
Compass
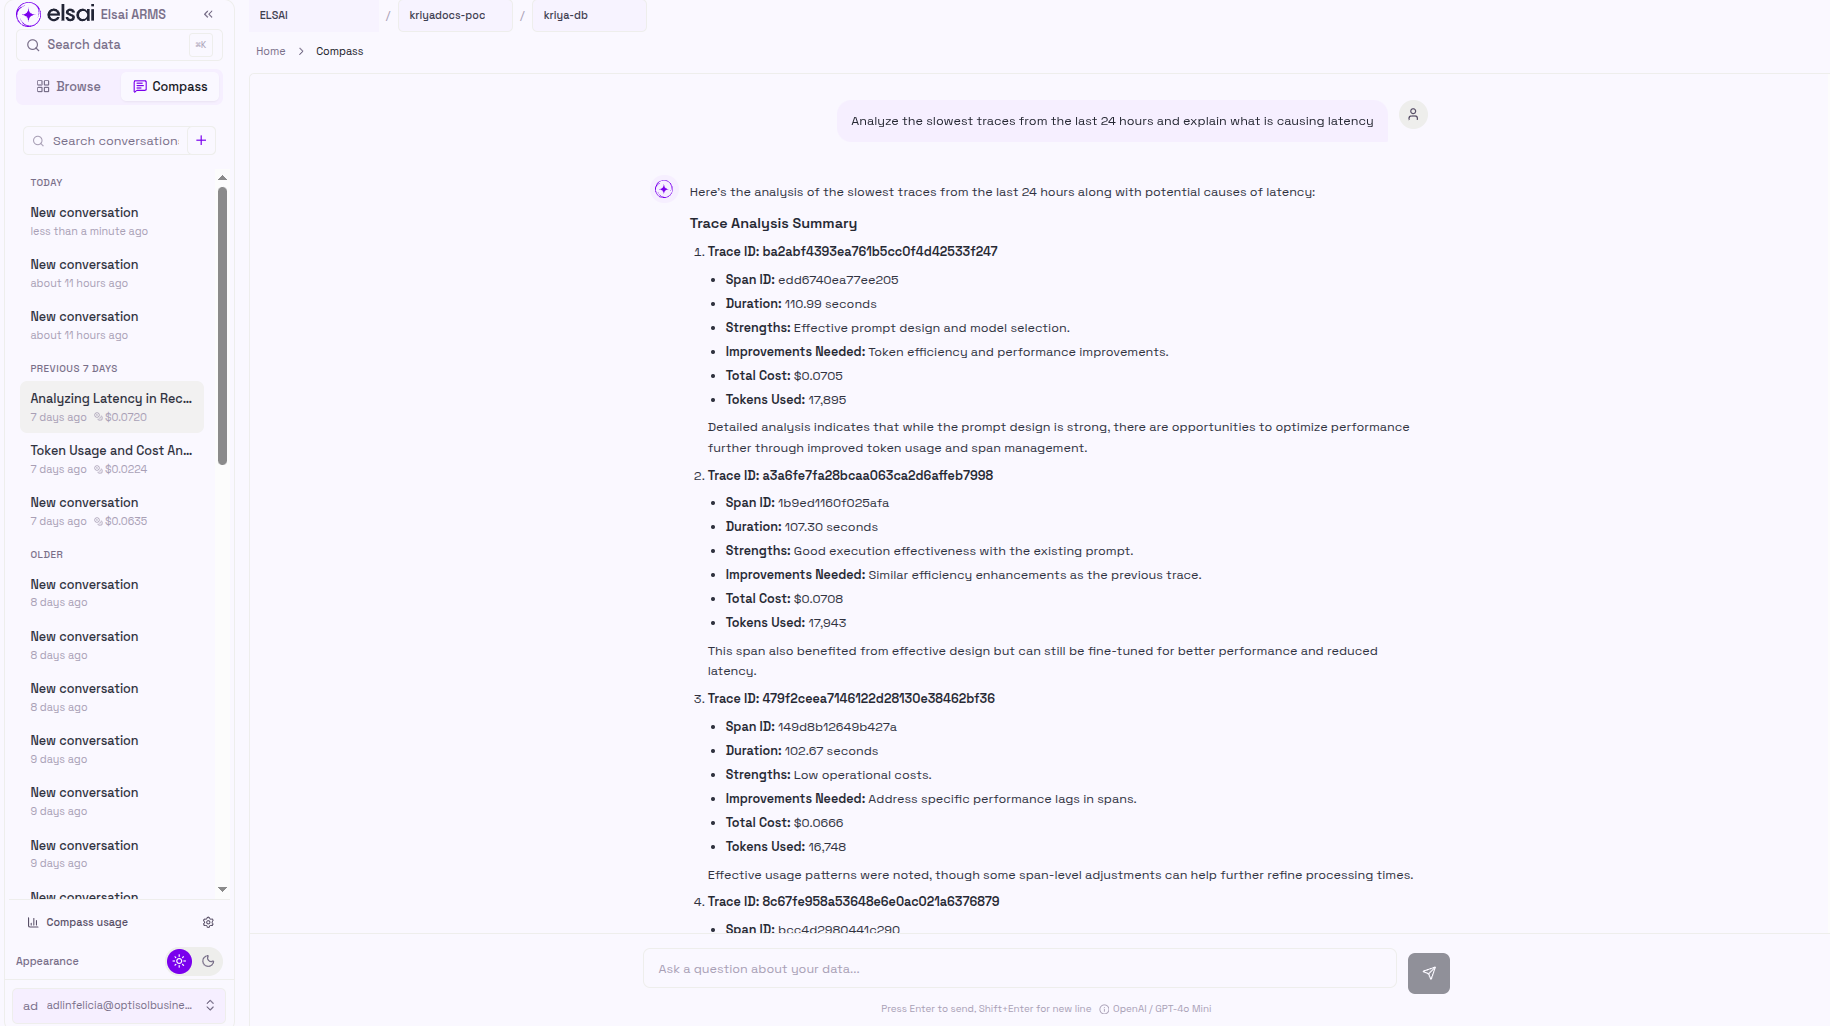
Compass is a built-in AI copilot that works across all of ARMS. Query your telemetry, analyze traces, and generate dashboards through natural language:
- Natural language queries - Ask questions about traces, costs, and tokens. Compass converts them to SQL and runs them inline.
- Trace and span analysis - Get structured AI analysis across performance, reliability, cost, token efficiency, and execution path.
- Dashboard generation - Describe the dashboard you want and Compass generates a complete importable layout with working queries.
- Resource management - Create vault secrets and custom models through conversation.
Frequently asked questions
What is ARMS?
ARMS is an AI Engineering platform. It traces LLM and agent calls via OpenTelemetry, tracks cost and token usage, and runs automated evaluations.
How do I get an on-prem or private deployment?
Contact dev@elsaifoundry.com. Public self-host install guides are not published in these docs.
Does ARMS require code changes to instrument my app?
No. ARMS's SDK auto-instruments 90+ LLMs, agent frameworks, and vector databases with zero code changes, or you can call elsai_arms.init() once for manual instrumentation if you want more control - both produce the same OpenTelemetry traces.
How is ARMS different from other LLM observability tools?
ARMS combines AI observability, evaluation, and cost tracking in one platform, instead of requiring separate tools for tracing and evals.